Are your customers interested in your competitors’ products? Which influencers do they like?
Measuring customers’ interest is not easy. Surveys can provide answers but are expensive. Questions are limited while possible competitors and influencers are many. Above all, the data are opinions not behaviors.
Twitter Correlation Analysis
How can we measure customers’ interest broadly with a low cost? Today, many customers turn to social media for new information. They follow accounts that seem continuously interesting.
Twitter provides limited but valuable information through Twitter Developer Platform. Using the data available, we’ve built a system called “Twitter Correlation Analysis” to answer our questions. Twitter correlation analysis measures how an account’s followers are following other accounts. It reveals how fans are interested in other brands, products, platforms, media and influencers.
Let’s look at an example.

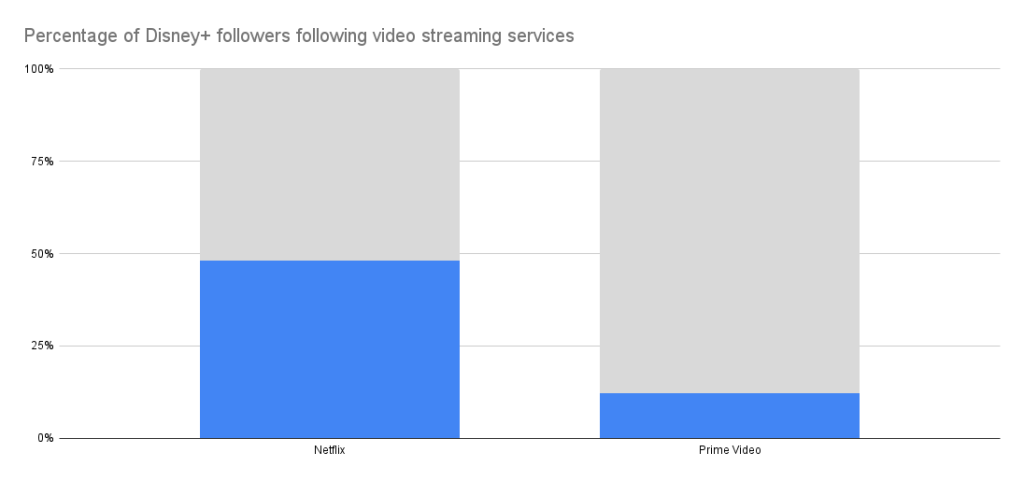
This graph shows how Disney+ followers are following competing streaming services.
48% of Disney+ followers follow Netflix. This is high based on our experience, but keep in mind that Netflix has 4x more followers than Disney+. They seem to be competing in the same field, which is unwise when subscribers can switch between the two within a few clicks.
12% of Disney+ followers follow Prime Video. Is this a low number? Since Prime video only has about half as many followers as Disney+, it is natural to have a lower number than Netflix. Still, over a tenth follow Prime Video, which may indicate that whatever Prime Video offers might provide a hint for Disney+ growth.
(Please note that these data were taken in the summer of 2022 and are not up to date.)
Customer Data Across Platforms
This sample compares two accounts, but could go further. How are Disney+ followers following Hulu? or HBO Max? or Crunchyroll?
You can go beyond direct competitors. Do streaming services followers follow gaming platforms like PlayStation? Do they follow Xbox Game Pass, a gaming subscription? Since Netflix started an ad supported plan, they might want to compare with Spotify for similar customer traits.
If you are a multinational company, you can compare between local accounts. How are Disney+ Brasil users following Netflix Brasil? If you have multiple brands, you can look within your company. How do Netflix followers follow The Crown? How many of Disney+ followers follow Disney Parks?
You’ve got the idea by now.
Twitter correlation analysis can be applied to various companies and individuals. You can discover potential competitors or partners. You can investigate potential markets. You can can test whether your new product features fit your customers. You can optimize your marketing budget. It provides customer correlations among brands, across platforms and locations.
Tell Us Two Accounts To Compare
Since our Twitter correlation analysis is unique, we would like you to experience the power with data that matters to you.
If you have a twitter account, please let us know your account along with another account you want to compare with. We will provide you a sample graph like above with the accounts you specify.
Even if you don’t have a twitter account, or don’t have many followers, tell us your industry’s benchmark account for a start. We can then compare the benchmark account with another account you would like to compare.
Get Customized Samples for FREE.
These samples are FREE and we will send you via email. I hope you can grasp the power of our Twitter Correlation Analysis with the sample customized for you. If you are interested, we can hold a web meeting to discuss further steps.
Please let us know if you are interested via the contact page on this website or our twitter account(takashi_fujii_e).
Thank you for reading this post. We look forward to hearing from you!
